The code for these custom reports is available on github.
What it does
Before we dive into the implementation, let's take a quick tour of the custom reporting features.
Team Status
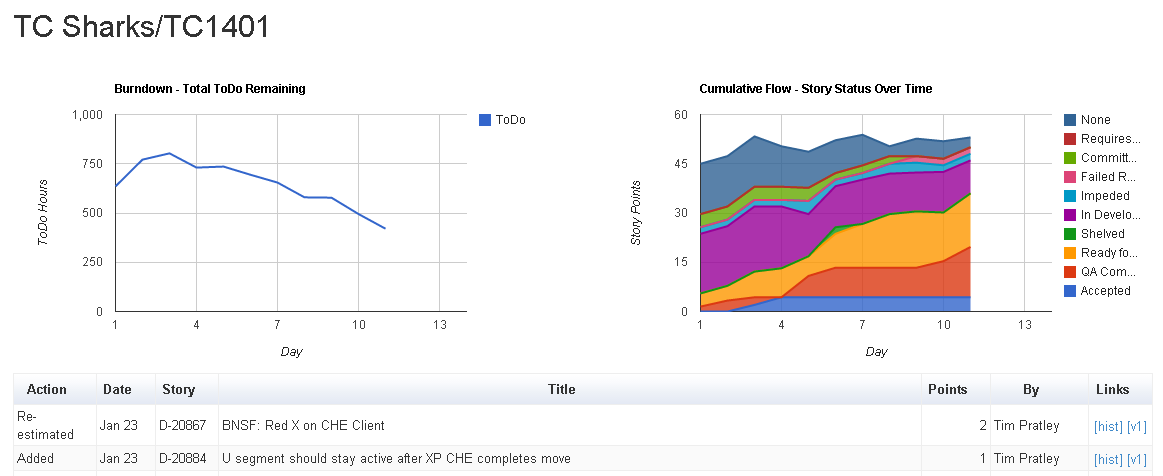
You can view the high level status of all teams on one page. There is a burndown of the todo hours, the cumulative flow of story status and a table of churn items which have been re-estimated, added to or removed from the sprint.
Story History
Clicking on the [hist] link opens a new tab in your browser showing the history of the story in chronological order, most recent first. The history shows only the changed values and displays the before and after. The VersionOne history forces you to click in to each change, look for fields with a + near them and expand them to identify changes. This custom view saves a lot of time as you can visually scan what people have applied what changes recently.
Retrospective
At the end of our sprints we meet to evaluate what worked well and what we can do better.
Burndowns, cumulative flows, velocity, stats (estimation vs actual, billable, capacity, efficiency, defects, tests, member contribution), failed review, churn, stories, splits, customer focus, you name it - you'll find it here!Burndown comparison over the last 4 sprints helps identifying trends:
Churn shows how much work is being inserted and removed from the sprint:
High failed review counts can indicate a lack of communication between Dev/QA/Prod about what is required for the story:
You can view the other charts and tables at your leisure on the site.
Defect Rate
Per project you can see how many defects remain open, and the total number in the system. The idea here is that as we near a release date, the open defects should be approaching zero. Inspired by chapter 16 of the Software project survival guide.
Open Items
Often several release projects are underway and it is useful to see a table of open stories to monitor the status of work remaining.
Roadmap
The roadmap shows the total story points per sprint. Dates in the past are done work, dates in the future are planned work. The table indicates:
The roadmap is presented as a pivot table which means you can view the data by team, project, customer, or any combination of those as aggregated data.
- whether projected work is reasonable
- where effort is being focused
- how cross team projects are lining up
The roadmap is presented as a pivot table which means you can view the data by team, project, customer, or any combination of those as aggregated data.
Fable
This page detects unbelievable stories. Fables are stories that have certain attributes missing, incorrect, or inconsistent. The page checks for:
- a valid estimate
- a success criteria
- a description length greater than the template
- 2 owners (Dev and QA)
Conclusion
VersionOne stores a lot of very useful data about what teams are doing. There are a plethora of interesting aspects to the data for reporting purposes which can be quite powerful when customized to your process interests.If you are a VersionOne user, please give this reporting tool a try! Visit github for instructions on how to run it, and feel free to contact me with any questions.


